In this article we will be installing GeoPandas in order to start working with geospatial data. We won’t be doing anything too complex in this part, just Vectors and basics of GeoPandas.
Vectors
Before we start working with GeoPandas, let’s first understand what vector data actually means in GIS.
Vector data is basically a way of representing real-world objects using geometries. There are three basic types of vector geometries: Points, Lines and Polygons. A Point represents a single location. For example, a mountain peak, a city, a restaurant or a bus stop can all be represented as a point. A Line is used to represent things that have a path or length, like roads, rivers, railway tracks or routes. A line is made up of multiple points connected together. A Polygon represents an enclosed area. Things like countries, states, lakes, buildings or land can be represented using polygons.
In our case, we are going to work with the mountain peaks from the previous article. Each mountain peak has a latitude and longitude, so it can be represented as a Point. For example, Mount Mitchell has the coordinates 35.7648° N, 82.2652° W. These coordinates tell us where that particular point is located on Earth.
Now that we know what a Point is and how coordinates define its location, we can use Python to actually turn our latitude and longitude values into point geometries.
This is where GeoPandas comes in.
GeoPandas
Note : Make sure you have Python installed in your system.
If you have worked with Python before, then you might know how to download packages. So we will use the pip command,
do pip install geopandas.
Under the hood GeoPandas relies on Shapely, Fiona and GDAL for handling geometry and geospatial formats.
GeoPandas is built on top of Pandas so whatever you can do in Pandas, you can do it in GeoPandas as well. The only difference is that a GeoPandas dataframe has a geometry column that defines the geometry of that particular row. This geometry can be a Point, Line or Polygon and allows GeoPandas to understand the spatial information present in the data.
In the first article there was a table of top 5 peaks of the Appalachian Mountains. We will use that as our data to work with.
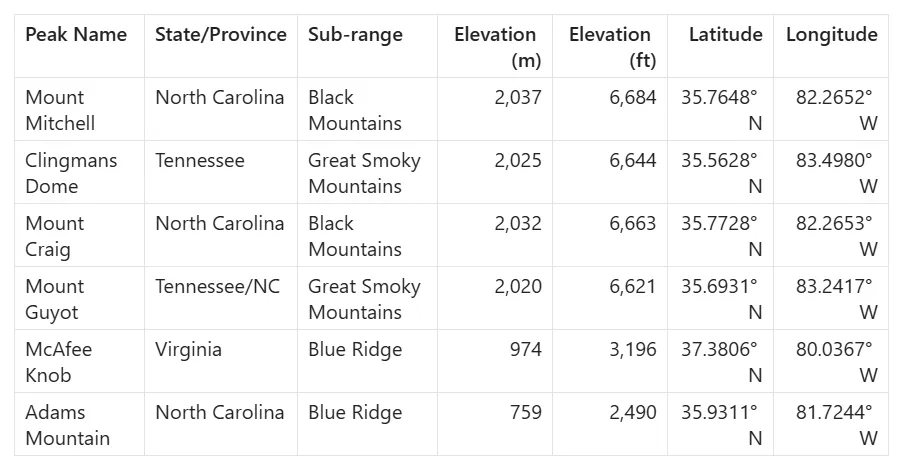
So I will first create a Pandas dataframe using the table above,
Let’s import all the necessary packages, using the below command,
import pandas as pd
import geopandas as gpd
Next let’s import that table of mountain peaks inside of a dictionary and change it into pandas dataframe,
data = {
    "Peak Name": ["Mount Mitchell", "Clingmans Dome", "Mount Craig", "Mount Guyot", "McAfee Knob", "Adams Mountain"],
    "State/Province": ["North Carolina", "Tennessee", "North Carolina", "Tennessee/NC", "Virginia", "North Carolina"],
    "Sub-range": ["Black Mountains", "Great Smoky Mountains", "Black Mountains", "Great Smoky Mountains", "Blue Ridge", "Blue Ridge"],
    "Elevation (m)": [2037, 2025, 2032, 2020, 974, 759],
    "Elevation (ft)": [6684, 6644, 6663, 6621, 3196, 2490],
    "Latitude": [35.7648, 35.5628, 35.7728, 35.6931, 37.3806, 35.9311],
    "Longitude": [-82.2652, -83.4980, -82.2653, -83.2417, -80.0367, -81.7244]
}

df = pd.DataFrame(data)
df
This will be the expected output,
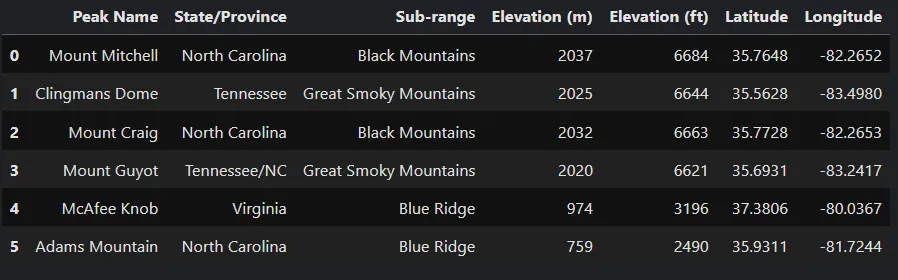
So just like we talked about, that GeoPandas has a geometry column that shows the geometry of that particular row data.
geometry = gpd.points_from_xy(df["Longitude"], df["Latitude"])we will use the points_from_xy function to convert the longitude and latitude into the point geometry and store it into the geometry column.
gdf = gpd.GeoDataFrame(df, geometry=geometry, crs="EPSG:4326")
gdf
Then we will input all of the data as parameters into the GeoDataFrame function of gpd as shown above.
We passed the dataframe that we had created using Pandas and the geometry variable as well.
This will result in a GeoDataFrame. And if you have a closer look, you can see that we have passed the CRS parameter as EPSG:4326.
It is the WGS 84 geographic coordinate system that we talked about in our previous article.
And this will be the expected output below,
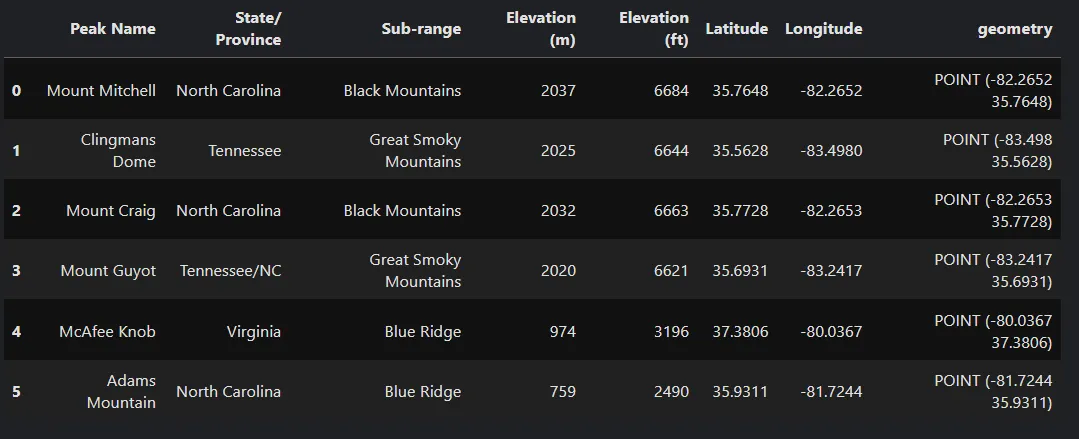
Then you can use functions similar to pandas to manipulate and update the data as you like,
gdf.head()
print(gdf.crs)
print(type(gdf))
This is enough to get started with vector data in GeoPandas. There is obviously a lot more that we can do with these geometries, but I’ll cover that in the next article where we’ll start working with some actual spatial operations and see how GeoPandas gets interesting.