What is GIS?
Based on Google’s definition this is what GIS is -
A Geographic Information System (GIS) is a computer based system designed to capture, store, manage, analyze and display data that is tied to a specific location on Earth. It combines hardware, software and data to let you see patterns, relationships and trends in geographic information that would be hard to spot in a plain table of numbers.
So basically in simple terms GIS is maps + data + analysis all working together.
GIS Data
This generally comes in two forms
- Spatial Data - the coordinates of a city, the path of river etc.
- Attribute Data - population, elevation etc. i.e. descriptive info tied to that location.
This below is a table of the highest peaks of Appalachian Mountains, it’s mentioned here to show an example of how GIS data looks like.
| Peak Name | State/Province | Sub-range | Elevation (m) | Elevation (ft) | Latitude | Longitude |
|---|---|---|---|---|---|---|
| Mount Mitchell | North Carolina | Black Mountains | 2,037 | 6,684 | 35.7648° N | 82.2652° W |
| Clingmans Dome | Tennessee | Great Smoky Mountains | 2,025 | 6,644 | 35.5628° N | 83.4980° W |
| Mount Craig | North Carolina | Black Mountains | 2,032 | 6,663 | 35.7728° N | 82.2653° W |
| Mount Guyot | Tennessee/NC | Great Smoky Mountains | 2,020 | 6,621 | 35.6931° N | 83.2417° W |
| McAfee Knob | Virginia | Blue Ridge | 974 | 3,196 | 37.3806° N | 80.0367° W |
| Adams Mountain | North Carolina | Blue Ridge | 759 | 2,490 | 35.9311° N | 81.7244° W |
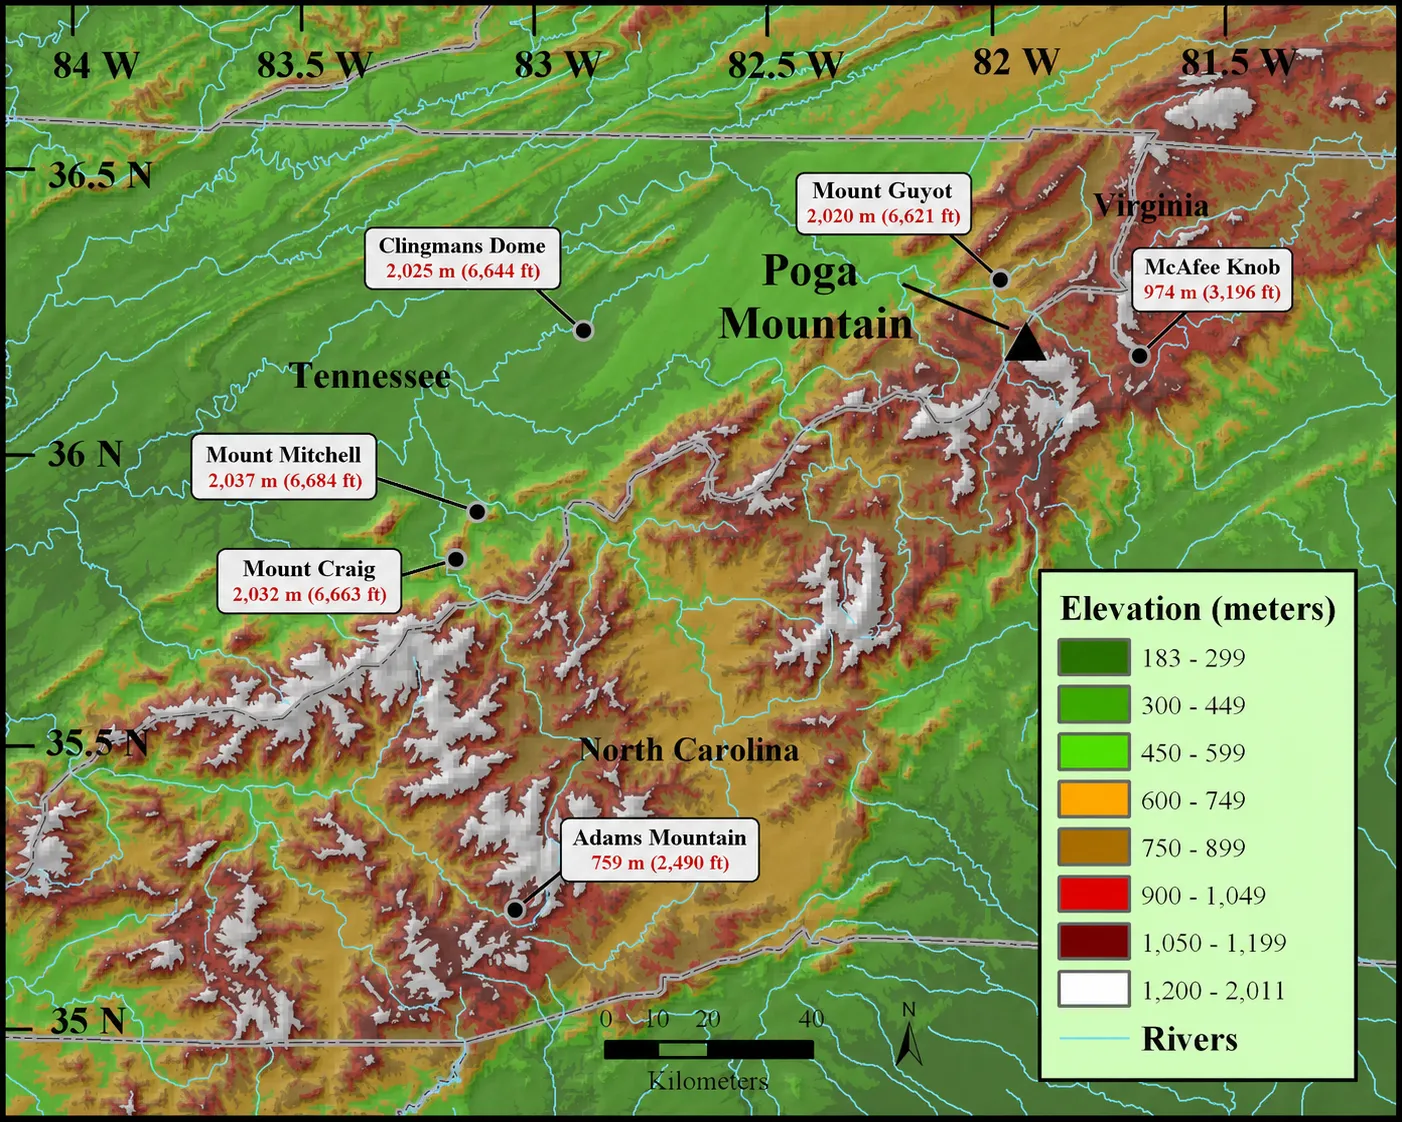
GIS Application
This is the software or programs that are used to work with that GIS data. These are some examples,
- QGIS
- ArcGIS
- Google Earth Engine
- PostGIS
Types of Data
GIS systems work on many types of data, for example, vector data and raster data.
Vector data are stored as a series of (X, Y) coordinate pairs. They are used to represent points, lines and areas.
Raster data are stored as grid values.
Coordinate Reference System
Think of CRS as a system that tells you how a location on Earth is represented using coordinates.
Imagine you have a globe because Earth is 3D. So a location on earth can be described using latitude and longitude.
For example, New York ≈ 40.7° N, 74.0° W
These are angular coordinates represented in degrees.
But the screen of your computer is flat and it’s 2D or a sheet of paper is flat, therefore you have a problem, which is that how do you take the curved globe and put in onto a flat surface.
That is what a map projection is used for. It is a mathematical method to transform a curved surface into a flat surface.
And this is where the distinction between map projection and CRS becomes kind of important, while a map projection tells us how to mathematically transform Earth into a flat surface, a CRS systems tells us, what coordinate systems are we using and how should these coordinates be interpreted as real locations.
For eg. WGS 84 is commonly used as a CRS for latitude and longitude. Let’s say you want to see the result of New York ≈ 40.7° N, 74.0° W into UTM Zone 18N, then it would come out something as X = 583,958 m E and Y = 4,507,343 m N.
These numbers look completely different but they can represent the same physical location on Earth.
Types of CRS
There are two main types of CRS :
- Geographic Coordinate Reference System (GCRS)
- Projected Coordinate Reference System (PCRS)
A Geographic Coordinate Reference System (GCRS) represents a location using latitude and longitude. While a Projected Coordinate Reference System (PCRS) takes those geographic coordinates and uses a map projection to represent them on a flat surface.
GCRS is used in GPS coordinates and works on WGS 84. While a PCRS is beneficial because in many real-world calculations it becomes easier to calculate distance between two places when you have them marked on a flat surface, because degrees of latitude/longitude aren’t uniform distances, like a degree of longitude shrinks as you approach the poles.
There are three main projection families:
- Cylindrical
- Conical
- Planar
Cylindrical projection basically projects the Earth onto a cylinder and is commonly used for world maps and areas around the equator.
Conical projection uses a cone and works well for regions in the middle latitudes, especially areas that stretch more from east to west.
Planar or azimuthal projection projects the Earth onto a flat plane and is commonly used for polar regions or maps focused around one particular point.